Price dispersion
Inspect minimum, median, mean, and maximum listing prices. Trace changes back to stored source observations without inventing a trade tape.
Metric: observed median$1.84
Research skins, knives, cases, and collectibles through price history, listing supply, and market activity. Grounded in stored market observations.
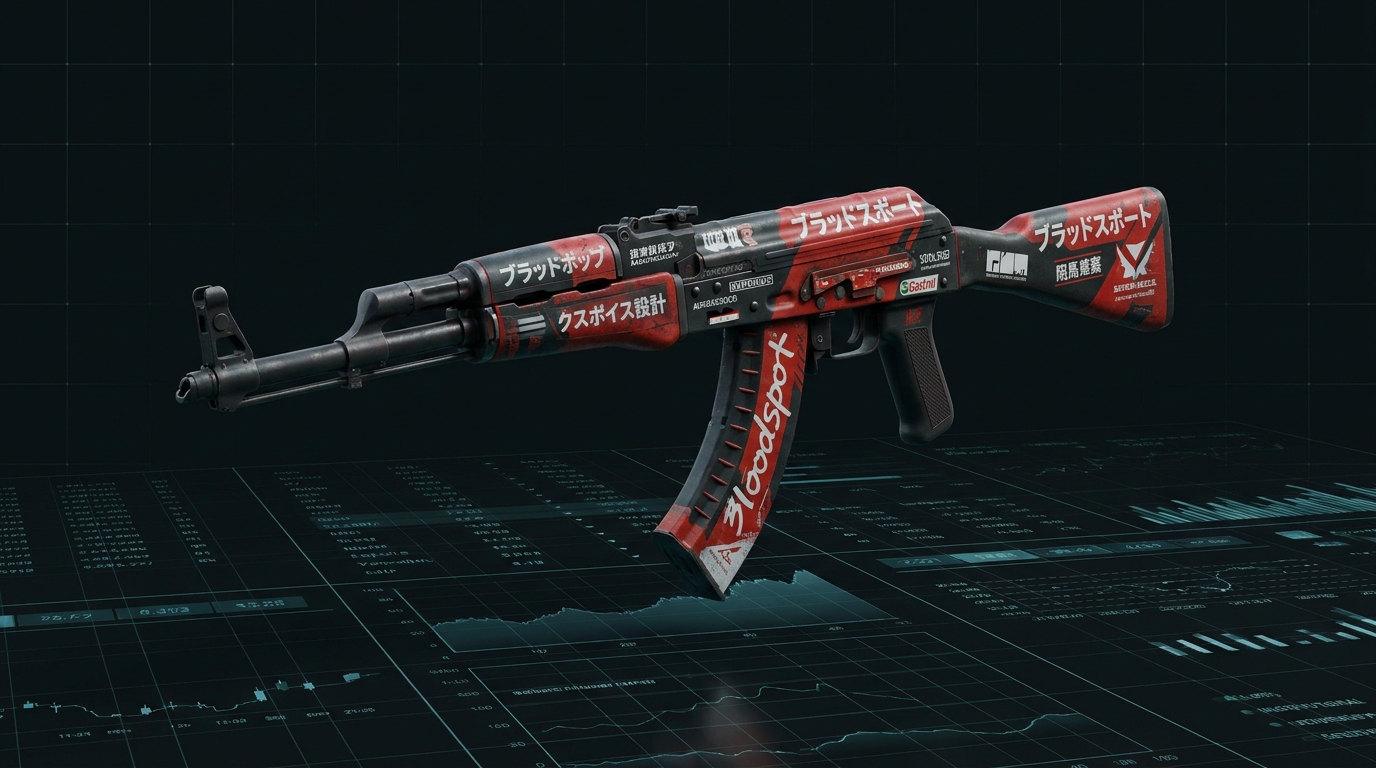
100-ASSET EXPERIMENT · SKINPORT OBSERVATIONS
Follow price history alongside listing supply and published market activity. Three dimensions of the same asset, observed over time.
A single price cannot describe the whole market. Inspect three complementary dimensions, grounded in the same source observations.
Inspect minimum, median, mean, and maximum listing prices. Trace changes back to stored source observations without inventing a trade tape.
Track how available listing quantities change through time. Comparisons remain collecting until an observed baseline is available.
Read recent source-published sales aggregates alongside listing supply. Rolling windows are not individual trades or independent daily totals.
Consider price, supply, and activity together, with source evidence in view.
The terminal brings the tracked universe into one view: observed prices, listing availability, and published sales activity, with comparisons as history accumulates.
Filter the tracked universe by category and observed price. Pro adds AND conditions on supported fields, saved screens, and exports of the matching observations.
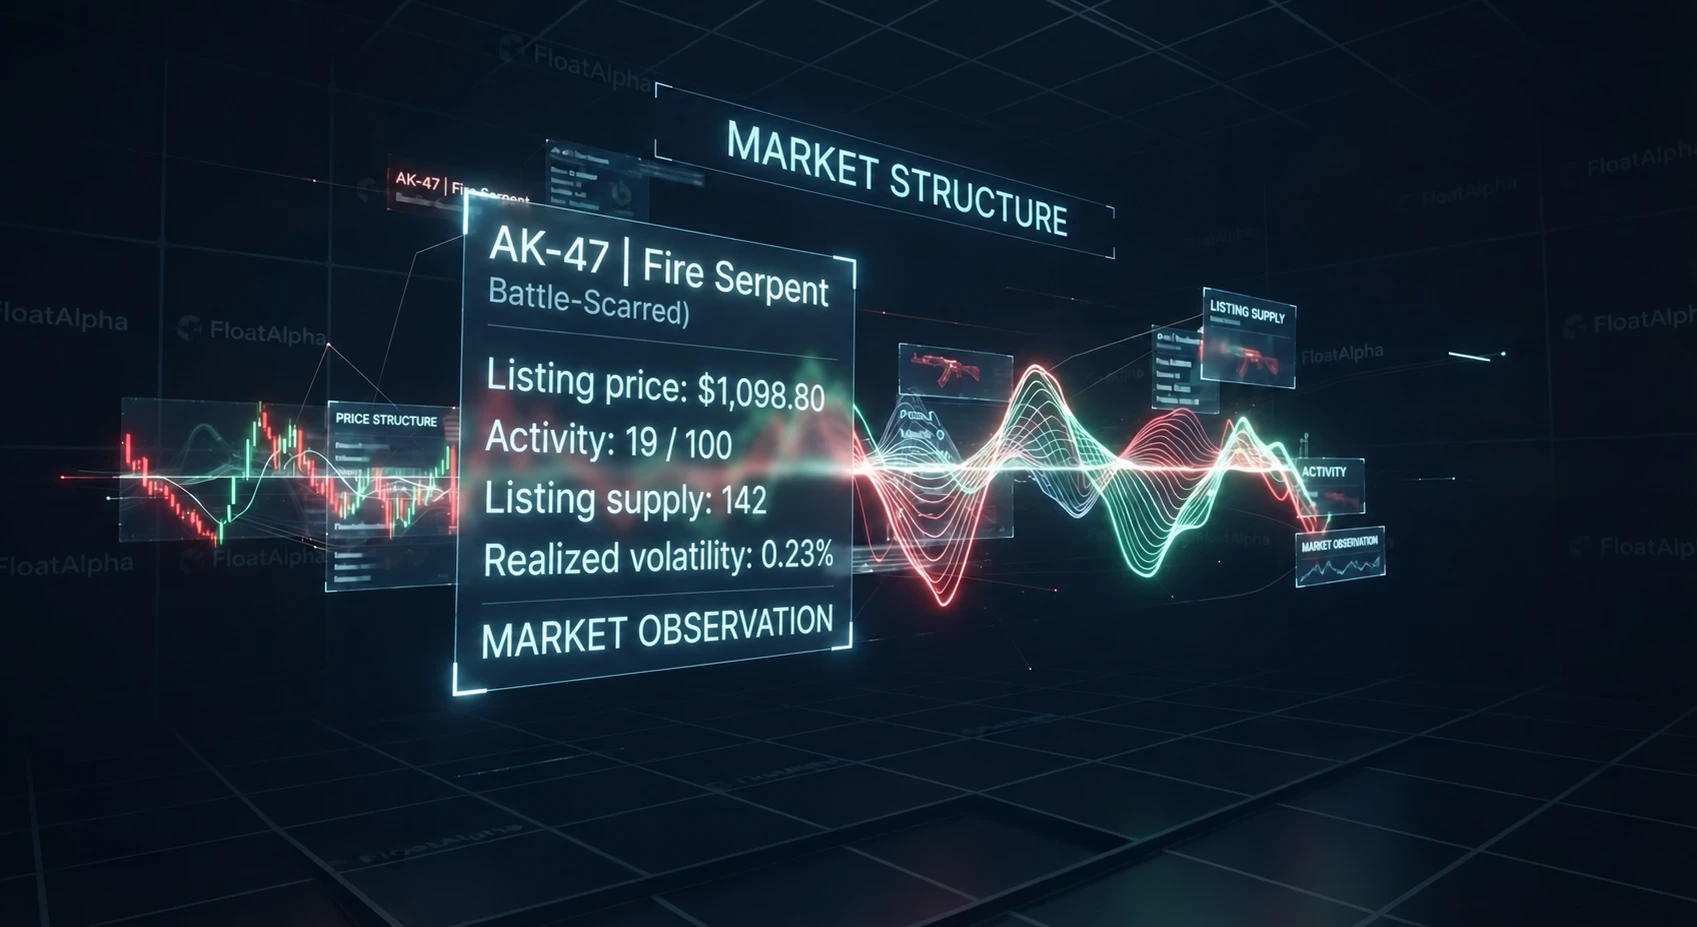
Asset Intelligence combines available observation history, price structure, listing supply, and sales aggregates. Source timestamps keep the evidence visible.
A dense research workspace for observed market data, transparent comparisons, and personal monitoring.
View the tracked pilot universe through current prices, listing quantities, sales aggregates, and available historical comparisons.
Filter observed assets by category and price. Combine supported conditions, save screens, and export matching observations with Pro.
Inspect the observations behind an asset: available history, price structure, listing supply, sales aggregates, and source provenance.
Keep the evidence behind a price visible. Confidence classification remains unavailable until a methodology is validated.
Track saved assets and manual holdings. Compare acknowledged observations and inspect cost basis, valuation, and concentration.
Save conditions on supported metrics. Scheduled evaluation notifies once when a configured condition changes from false to true.
Listing supply and sales activity provide context for a displayed price. These facts alone do not establish a validated confidence classification.
Higher listing availability within the tracked universe. This is source context, not a confidence grade or an execution guarantee.
Lower listing availability within the tracked universe. The observed price remains a source fact; its confidence classification is unavailable.
Skinport observations · 100-asset pilot universe · Stored source timestamps and explicit data states, without synthetic volume padding.
Published source values preserved with observation timestamps. Real zero quantities and zero sales remain valid observations.
Comparisons calculated from stored observations. Missing baselines do not become invented changes or substitute zero values.
Experimental methods require explicit labeling and validation. No prototype score or statistical classification is presented as established.
Clearly identified when history is still accumulating or a value cannot be calculated. No synthetic backfill or interpolation.
| Asset | Minimum · USD | Return · 24h | Listings | Activity · 1h |
|---|---|---|---|---|
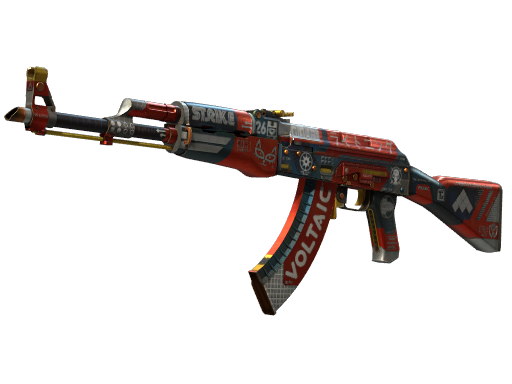
| AK-47 | Bloodsport (Field-Tested) | 157.64 | -3.87% | 299 | 4.17 |
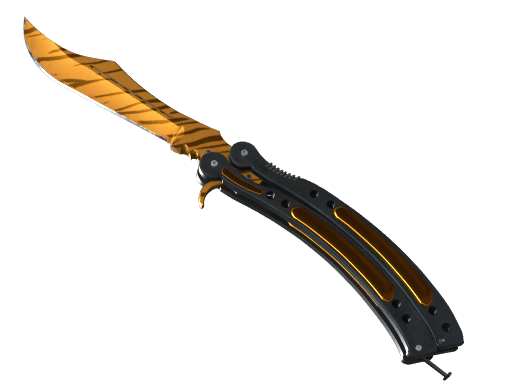
| ★ Butterfly Knife | Tiger Tooth (Factory New) | 1,655.83 | -0.07% | 35 | 4.17 |
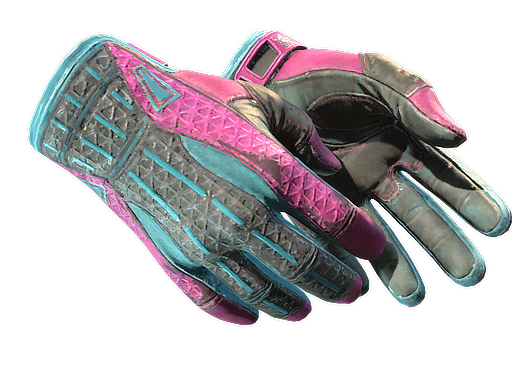
| ★ Sport Gloves | Vice (Field-Tested) | 906.51 | -0.14% | 56 | 0.00 |
| Dreams & Nightmares Case | 1.85 | 5.11% | 18,218 | 41.67 |
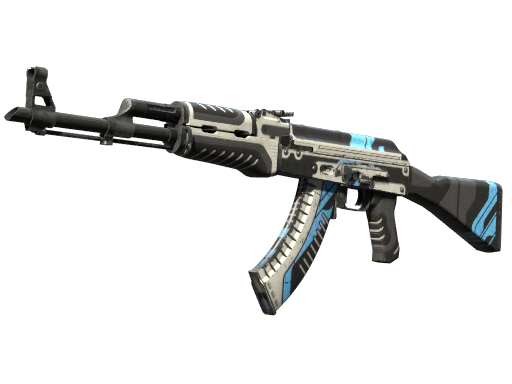
| AK-47 | Vulcan (Field-Tested) | 179.00 | -8.16% | 184 | 41.67 |
Compare observed listing references, their changes and data completeness. These examples use the same seeded demonstration as the product; they are not current market quotes.
Explore Screener ↗Minimum listing reference · USD
In this synthetic example, the 24h minimum listing reference changed -3.87%. Activity measures changes in price and listing quantity, not executed sales. No directional prediction is assigned.
Explore Asset Intelligence ↗Start with grounded market observations. Add deeper history access and personal monitoring when those capabilities fit your workflow.
Explore the tracked universe and core asset observations with the same underlying market facts.
Advanced screening, saved conditions, and personal monitoring over the same source observations.
Descriptive market observations only. No predictive financial tips.
Source facts and comparisons stay distinguishable, with their observation context.
Explicit source provenance and separate observation and update timestamps.
Unvalidated classifications remain unavailable. Evidence is never a prediction.
Missing data is explicitly flagged. Zero synthetic interpolation.
Explore the market through price, listing supply, and sales activity together, with the source evidence in view.
Open FloatAlphaFloatAlpha provides descriptive CS2 market information. Observations are not investment advice and do not guarantee future prices or sales activity. Data comes from stored Skinport snapshots. FloatAlpha is not affiliated with, sponsored by, or endorsed by Valve, Counter-Strike, or Skinport.